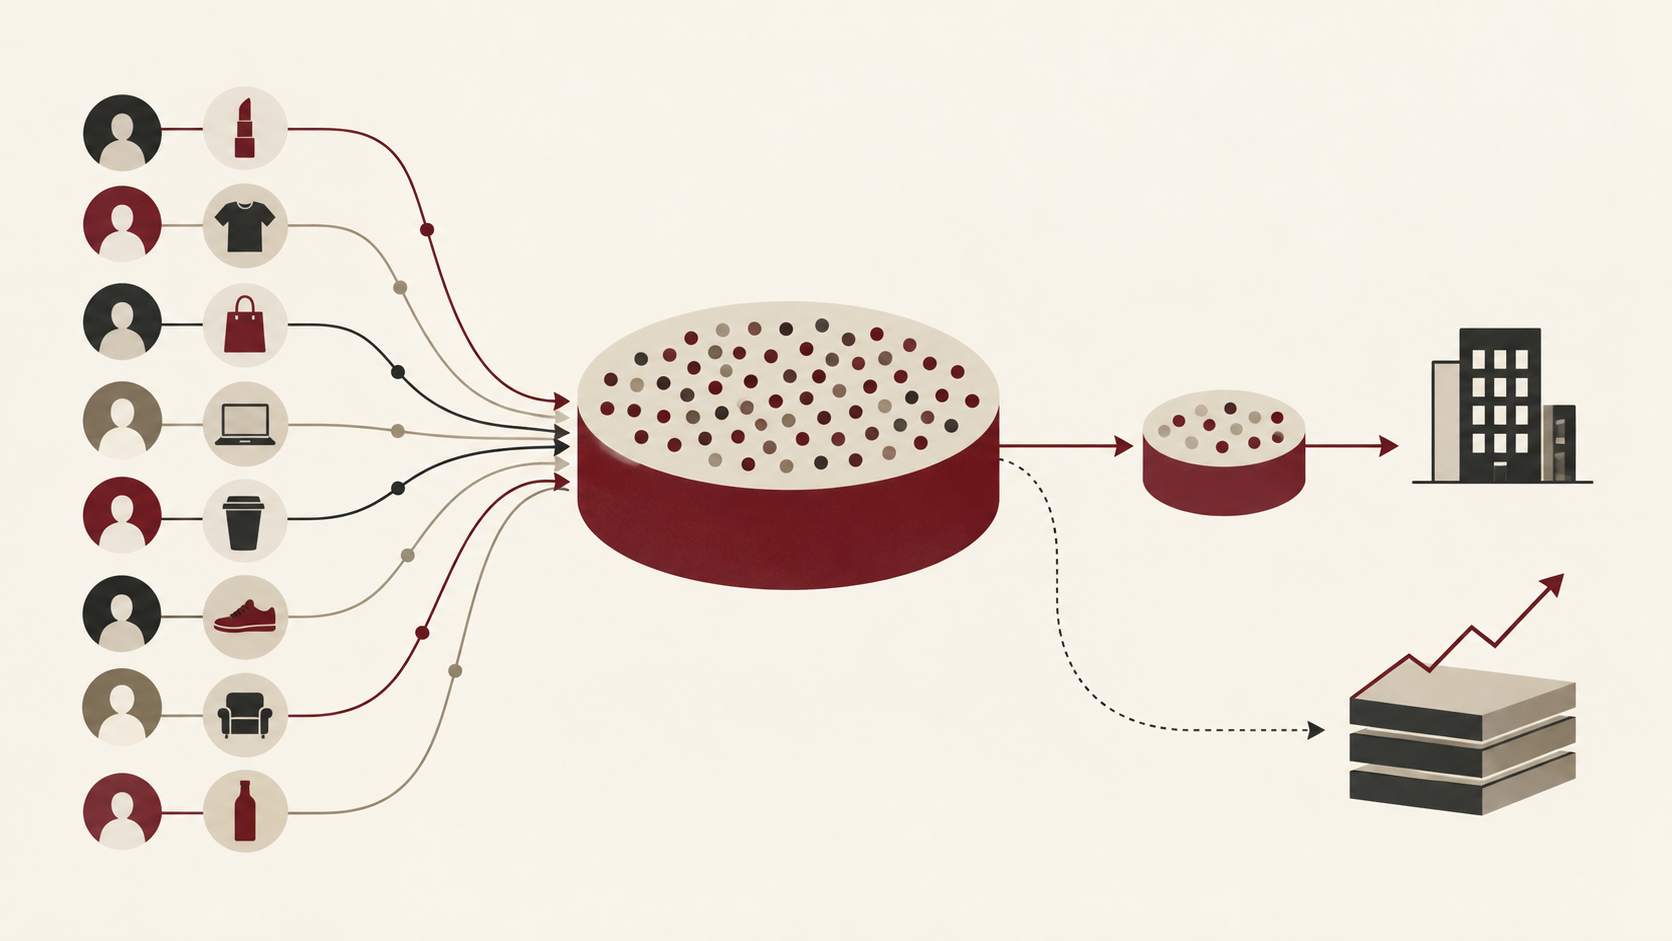
Market-size figures influence decisions ranging from product launches and market entry to startup fundraising and corporate investment. But the headline number is only meaningful when readers understand what is included, how it was calculated and how much of that market a company could realistically reach.
- A $100 billion market generally describes economic activity such as annual sales across a defined market, not an asset worth $100 billion.
- Market size, company revenue and market capitalization measure three different things.
- Researchers commonly use top-down, bottom-up or combined approaches to estimate markets when complete transaction data are unavailable.
- Market definitions matter: changing the products, geography, period or measurement method can significantly change the resulting number.
A business case might say the global market for a product is “worth $100 billion.” An earnings presentation might describe a company as competing in a $50 billion industry. A startup pitch deck might point to an even larger “addressable market.”
At first glance, those statements sound straightforward. There is a market, and apparently it has a price.
But a $100 billion market is not an asset worth $100 billion. Nobody owns the entire market, and there is no $100 billion price tag attached to it.
In most business contexts, market size is an estimate of how much economic activity takes place within a defined category over a defined period of time. Depending on the industry and methodology, researchers may measure that activity using revenue, retail sales, units sold, transactions or another relevant measure.
That distinction matters because market size is one of the most common—and easiest to misunderstand—numbers in business.
A Market Is Not a Company
Three numbers that often appear in business writing can sound similar while measuring completely different things: market size, company revenue and market capitalization.
Suppose an industry has annual sales of $100 billion.
That does not mean every company in the industry is collectively “worth” $100 billion. It means consumers or businesses spent roughly that amount on products or services included within the researcher’s definition of that market during the period being measured.
A company operating inside that market might generate $5 billion in annual revenue. That would represent only the sales of that particular business.
Its market capitalization, meanwhile, is something else entirely. For a publicly traded company, market cap is calculated by multiplying its share price by the number of shares outstanding. It reflects the stock market value of the company’s equity, not the amount consumers spend across its industry.
So the three concepts answer different questions:
Market size: How much economic activity occurs across this market?
Company revenue: How much does one company sell?
Market capitalization: How much does the stock market currently value a public company’s equity?
They may all be expressed in dollars, but they are not interchangeable.
So Who Decides How Big a Market Is?
There is rarely one organization that officially declares the size of an entire global market.
Government agencies can provide important building blocks. In the United States, for example, the Census Bureau’s Economic Census collects information including sales, receipts, revenue, establishments and employment across industries. The Census describes the Economic Census as the official measure of U.S. businesses and the economy.
But many of the market-size figures appearing in business reports come from research firms, consulting companies, industry organizations or companies themselves.
Researchers first have to decide exactly what counts as the market.
That sounds simple until the boundaries start moving.
Consider beauty. Does “the beauty market” include only skin care and makeup? What about fragrance and hair care? Sunscreen? Supplements? Cosmetic procedures? Spas?
The answer changes the number dramatically.
McKinsey's 2026 beauty research, for example, defines its core global beauty market around skin care, hair care, color cosmetics and fragrance. Its model projects those categories will reach about $590 billion in sales by 2030.
L’Oréal uses its own market definition and methodology. Its 2025 reporting estimated the global beauty market at more than €290 billion and broke that estimate down by regions including North America, North Asia, Europe, Latin America and SAPMENA-SSA.
Those figures should not automatically be treated as competing answers to exactly the same question. Different category boundaries, currencies, periods, pricing bases and methodologies can produce different estimates.
Before comparing two market-size numbers, the more useful question is often: What exactly is each number measuring?
How Do Researchers Calculate Something This Big?
Researchers obviously cannot stand at every checkout counter in the world and count every transaction.
Instead, market sizing combines available data with estimation.
Two common approaches are top-down and bottom-up analysis. Stanford Biodesign, for example, recommends examining a market from both directions because the resulting estimates can differ and comparing them can improve understanding of the opportunity.
A top-down calculation begins with a large population or existing industry figure and narrows it.
Imagine estimating the annual U.S. market for a hypothetical product.
A simplified calculation might look like this:
Number of potential consumers × percentage who buy the product × purchases per year × average price
If 20 million consumers bought an average of two products per year at $25 each, the estimated annual market would be:
20 million × 2 × $25 = $1 billion
A bottom-up calculation approaches the same question from smaller pieces of the market. Researchers might estimate sales per store, multiply by the number of stores, add online channels and then account for other distribution channels.
More sophisticated market research can combine company sales data, consumer surveys, government statistics, retailer information, channel data, expert interviews and proprietary datasets. McKinsey, for example, has described market assessments that triangulate top-down estimates, bottom-up analysis and expert input rather than relying on a single calculation.
The result is still an estimate.
It may be a highly researched estimate, but it is not the same thing as counting money sitting in a bank account.
Why Two Reports Can Give You Two Different Numbers
This also explains why searching for the size of an industry can produce surprisingly different answers.
One report might say a market is worth $80 billion while another puts it at $110 billion.
That does not necessarily mean one is wrong.
The researchers may be measuring different geographies. One might include wholesale revenue while another measures retail sales. One might use current exchange rates while another fixes exchange rates to make year-to-year comparisons easier. Their category definitions may also differ.
Even the same research organization can specify these details carefully. McKinsey says its 2026 Global Beauty Market Model covers regions, price tiers and channels across four core beauty categories and uses current prices with exchange rates fixed at 2025 levels.
That methodological note may look minor, but it tells readers what the headline number actually represents.
Market size therefore works best when read with four questions:
What products or services are included? Where is the market? What period is being measured? What metric is being used?
Without those boundaries, a large number can look more precise than it really is.
Why Companies Care About the Number
Market size becomes much more useful when it is treated as a business decision tool rather than simply an impressive statistic.
Imagine a company considering whether to launch a product in a new category.
A $2 billion market and a $100 billion market present very different potential revenue pools. But size alone is not enough. Management also wants to know how quickly the market is growing, which customer segments are driving that growth, how concentrated the competitors are and how much of the market the company could realistically reach.
This is where concepts such as TAM, SAM and SOM often enter startup and strategy discussions.
TAM, or total addressable market, describes the broad revenue opportunity if a product could serve the entire relevant market. SAM narrows that universe to the portion a company can actually serve given its product, geography or business model. SOM narrows it further toward the portion the business could realistically capture.
The distinction prevents a common mistake: assuming that operating in a huge industry automatically gives a company a huge business opportunity.
A startup entering a $100 billion industry does not suddenly have a $100 billion opportunity available to it. Its reachable customer base might represent only a small fraction of that total.
The Number Matters. The Definition Matters More.
Market-size figures appear authoritative because they usually arrive as one clean number: $50 billion, $100 billion, $500 billion.
The calculation behind them is much less tidy.
Markets have to be defined. Data have to be collected. Missing information has to be estimated. Categories have to be included or excluded. Researchers may then cross-check several methods before arriving at a figure.
That does not make market-size estimates meaningless. Quite the opposite: they help companies understand the scale of demand, compare industries, identify growth opportunities and decide where resources might be worth committing.
But the number becomes useful only when its definition is understood.
The next time a case study says a market is “worth $100 billion,” the better question is not simply whether $100 billion is big.
It is: $100 billion of what?
The useful skill is not memorizing that an industry is worth $100 billion. It is learning to interrogate the number. Market size is ultimately a model of economic activity built around a definition, and understanding that definition makes industry reports, case studies and startup pitch decks much easier to read critically.
- Government data U.S. Census Bureau — Economic Census (2002–2022), updated Apr. 30, 2026
- Government data U.S. Census Bureau — Sales, Receipts, Shipments, or Production
- Company research McKinsey & Company — From aisle to algorithm: The beauty categories, channels, and concepts shaping 2030 growth, June 18, 2026
- Company filing L’Oréal — 2025 Universal Registration Document: Beauty Market
- Academic research Stanford Biodesign — Top-Down and Bottom-Up Market Sizing Example